Home
Daily cycle data
Combined week
Combined month
Combined year
Daily cycle: extra plots
GPS Files
Github page of the project
Admin
Select a different time period for GPS data:
Start:
End:
Use date:
Only plot in shown area:
Zoom:
Cenlat:
Cenlng:
Replot
0
5
10
15
20
25
30
20
40
60
80
100
120
140
10
20
30
40
50
SRTM Elevation [m]
Elevation [m]
Speed (5 points)
Speed (50 points)
Cumlative Speed
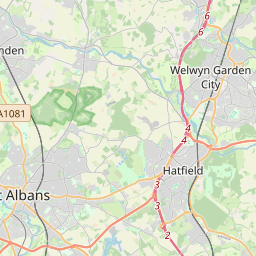
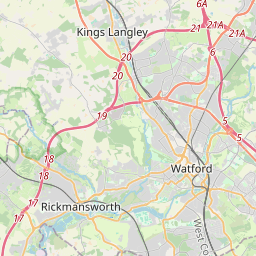
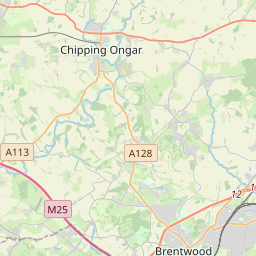
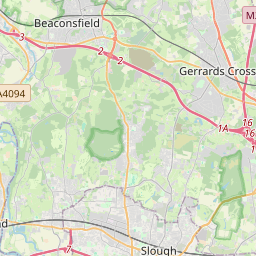
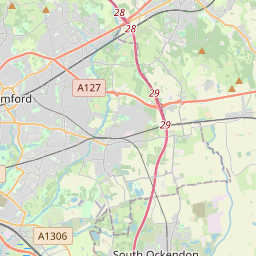
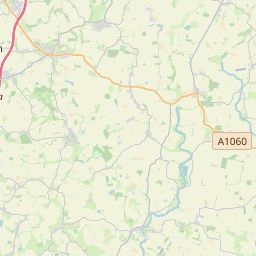
2019-04-03 20:30:05 to 2019-04-03 22:05:17 : 32.32 km, 1:16:55 moving, 25.21 km/h, 458 m up, -453 m down, SRTM: 364 m up, -279 m down
Distance [km]
Elevation [m]
Speed [km/h]
19:30
19:32
19:35
19:37
19:39
19:41
19:44
19:46
19:48
19:51
19:53
19:56
19:58
20:00
20:04
20:06
20:08
20:10
20:13
20:15
20:17
20:28
20:31
20:33
20:35
20:37
20:40
20:42
20:44
20:46
20:49
20:51
20:53
20:55
20:58
21:00
21:02
21:04
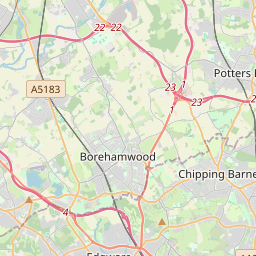
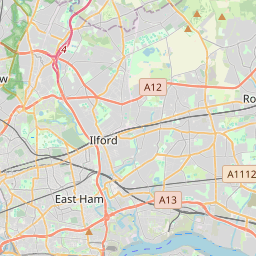
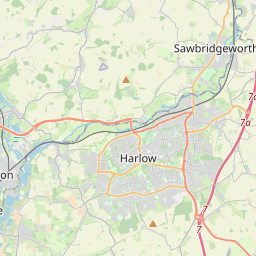
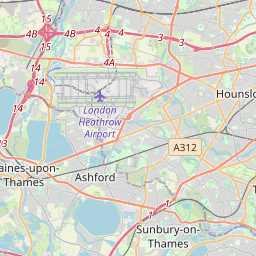
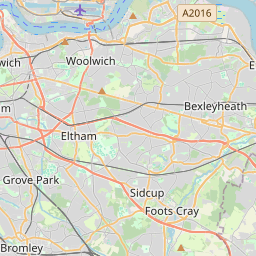
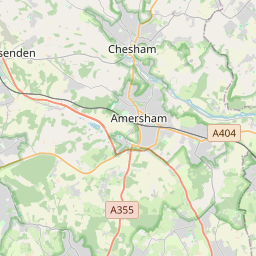
St Johns Wood
Cricklewood
St Albans
Park Street
Elstree
Radlett
Radlett
St Albans
Elstree
Elstree
Radlett
Edgeware
Park Street
St Albans
Cricklewood
Cricklewood
Edgeware
Edgeware
St Albans
Cricklewood
Edgeware
Edgeware
Cricklewood
Cricklewood
Edgeware
Edgeware
Cricklewood
Cricklewood
Edgeware
plotly-logomark
+
−
OpenStreetMap
SRTM 0m to 255m
SRTM 0m to 1023m
SRTM 0m to 2047m
SRTM 0m to 4095m
SRTM 1024m to 3071m
SRTM 2048m to 4095m
Leaflet
| ©
OpenStreetMap
contributors
Distanc - Duration - Speed
Start
End
32.32 km - 1:16:55 - 25.21 km/h
April 3, 2019, 8:28 p.m.
April 3, 2019, 10:05 p.m.