Home
Daily cycle data
Combined week
Combined month
Combined year
Daily cycle: extra plots
GPS Files
Github page of the project
Admin
Select a different time period for GPS data:
Start:
End:
Use date:
Only plot in shown area:
Zoom:
Cenlat:
Cenlng:
Replot
0
5
10
15
20
25
30
35
40
45
0
50
100
150
0
10
20
30
40
50
SRTM Elevation [m]
Elevation [m]
Speed (5 points)
Speed (50 points)
Cumlative Speed
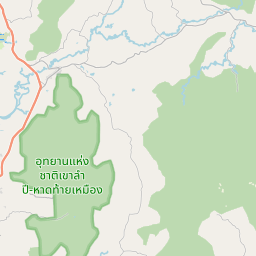
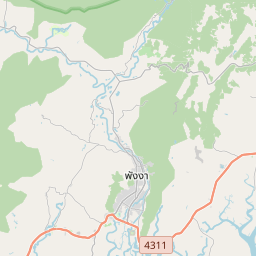
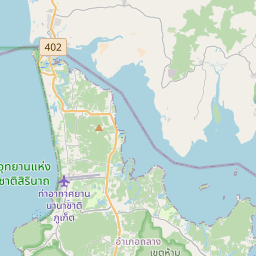
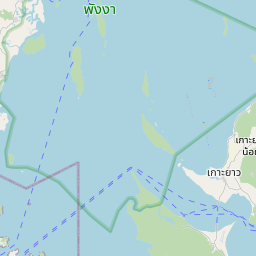
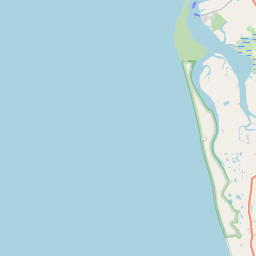
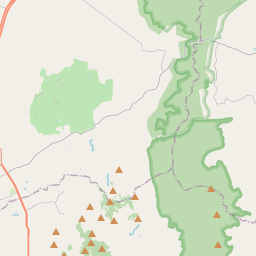
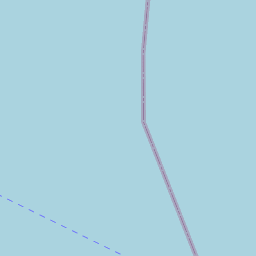
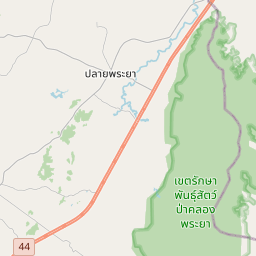
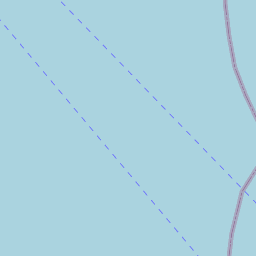
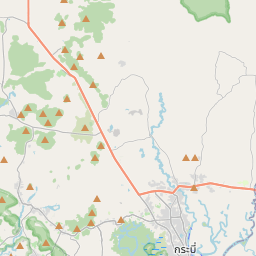
2018-12-07 05:48:12 to 2018-12-07 10:33:48 : 48.08 km, 2:01:01 moving, 23.84 km/h, 543 m up, -519 m down, SRTM: 865 m up, -850 m down
Distance [km]
Elevation [m]
Speed [km/h]
05:48
05:51
05:55
05:58
06:43
06:46
06:50
06:53
06:57
07:00
07:04
07:07
07:11
07:14
07:17
07:21
07:24
07:42
07:45
07:49
07:52
07:56
07:59
08:03
08:28
08:32
08:35
09:43
09:47
09:50
09:54
09:57
10:01
10:04
10:08
10:12
10:16
10:20
10:23
10:27
10:31
Kalai
Na Tai Pier und Strand
Na Tai Pier und Strand
Wat Suwan Khuha
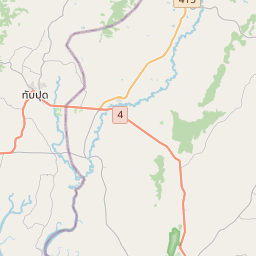
Ban Khok Kloi
Phang Gna
Kalai
Kalai
Phang Gna
Na Tai Pier und Strand
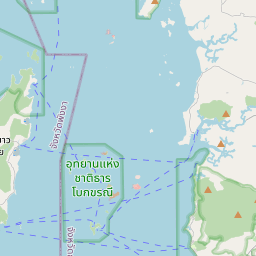
Phang Gna
Phang Gna
Phang Gna
Phang Gna
Phang Gna
plotly-logomark
+
−
OpenStreetMap
SRTM 0m to 255m
SRTM 0m to 1023m
SRTM 0m to 2047m
SRTM 0m to 4095m
SRTM 1024m to 3071m
SRTM 2048m to 4095m
Leaflet
| ©
OpenStreetMap
contributors
Distanc - Duration - Speed
Start
End
48.08 km - 2:01:01 - 23.84 km/h
Dec. 7, 2018, 5:48 a.m.
Dec. 7, 2018, 10:33 a.m.