Home
Daily cycle data
Combined week
Combined month
Combined year
Daily cycle: extra plots
GPS Files
Github page of the project
Admin
Select a different time period for GPS data:
Start:
End:
Use date:
Only plot in shown area:
Zoom:
Cenlat:
Cenlng:
Replot
0
10
20
30
40
50
60
70
80
90
300
400
500
600
10
20
30
40
50
SRTM Elevation [m]
Elevation [m]
Speed (5 points)
Speed (50 points)
Cumlative Speed
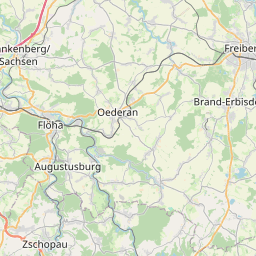
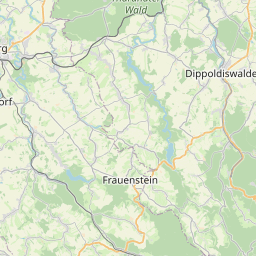
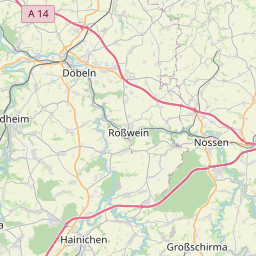
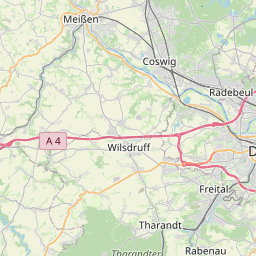
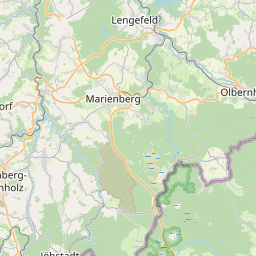
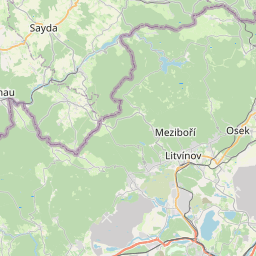
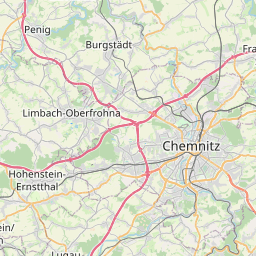
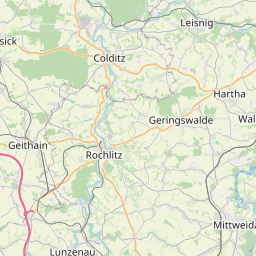
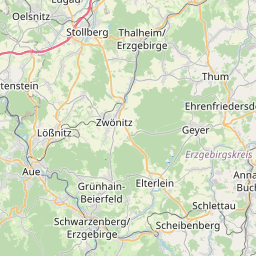
2014-05-04 09:46:08 to 2014-05-04 16:12:08 : 96.24 km, 4:28:55 moving, 21.47 km/h, 1393 m up, -1399 m down, SRTM: 1491 m up, -1491 m down
Distance [km]
Elevation [m]
Speed [km/h]
08:46
08:52
08:59
09:06
09:12
09:20
09:26
09:33
09:40
09:46
09:53
10:00
10:14
10:21
10:28
10:34
10:41
10:48
10:54
11:01
11:08
11:14
11:21
11:27
11:34
11:41
12:46
12:53
12:59
13:06
13:12
13:19
13:26
13:32
13:39
13:55
14:01
14:08
14:15
14:21
14:28
14:34
14:41
14:48
14:55
15:01
15:08
Oberreichenbach
St. Michaelis
Hetzdorfer Viadukt
Oberbobritzsch
Mulda
Oederan
Frauenstein
Nassau
Hammerleubsdorf
Breitenau
Großhartmannsdorf
Linda
Hilbersdorf
Loessnitztal
Breitenau-Wildgatter
Eppendorf
Eppendorf
Großhartmannsdorf
Oberbobritzsch
Oberbobritzsch
Frauenstein
Oederan
Mulda
Mulda
Oederan
Frauenstein
Großhartmannsdorf
plotly-logomark
+
−
OpenStreetMap
SRTM 0m to 255m
SRTM 0m to 1023m
SRTM 0m to 2047m
SRTM 0m to 4095m
SRTM 1024m to 3071m
SRTM 2048m to 4095m
Leaflet
| ©
OpenStreetMap
contributors
Distanc - Duration - Speed
Start
End
96.24 km - 4:28:55 - 21.47 km/h
May 4, 2014, 9:44 a.m.
May 4, 2014, 4:16 p.m.