Home
Daily cycle data
Combined week
Combined month
Combined year
Daily cycle: extra plots
GPS Files
Github page of the project
Admin
Select a different time period for GPS data:
Start:
End:
Use date:
Only plot in shown area:
Zoom:
Cenlat:
Cenlng:
Replot
0
20
40
60
80
100
120
140
200
250
300
350
400
450
500
550
10
20
30
40
50
SRTM Elevation [m]
Elevation [m]
Speed (5 points)
Speed (50 points)
Cumlative Speed
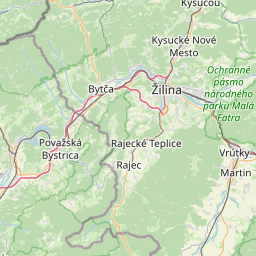
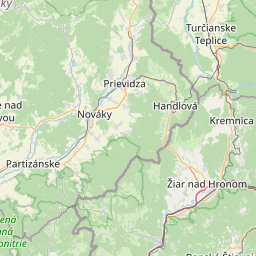
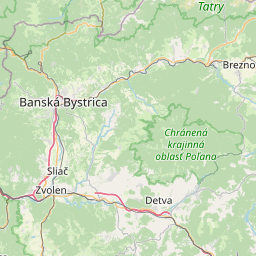
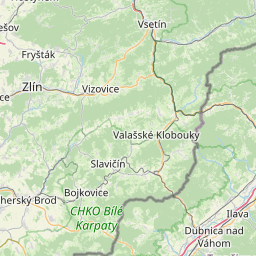
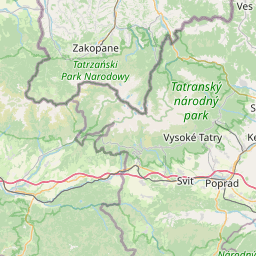
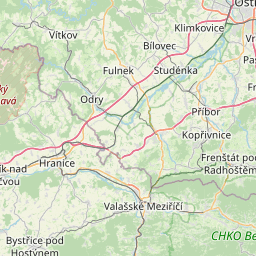
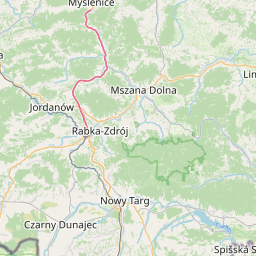
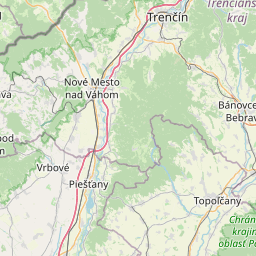
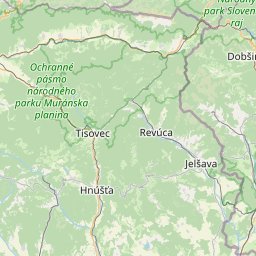
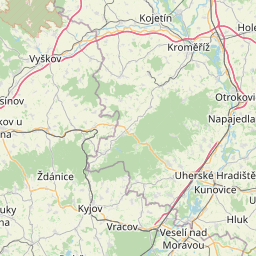
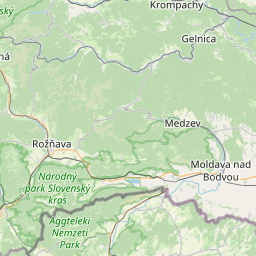
2013-09-30 08:17:41 to 2013-09-30 16:35:51 : 147.21 km, 5:43:14 moving, 25.73 km/h, 1209 m up, -1463 m down, SRTM: 1467 m up, -1715 m down
Distance [km]
Elevation [m]
Speed [km/h]
07:17
07:27
07:38
07:48
07:58
08:08
08:19
08:30
08:43
08:53
09:03
09:14
09:24
09:34
09:44
09:55
10:05
10:15
10:25
10:36
10:46
11:21
11:31
11:42
11:52
12:02
12:12
12:23
12:43
12:54
13:04
13:44
13:55
14:05
14:15
14:26
14:41
14:51
15:01
15:13
15:23
15:34
Puchov
Lednicke Rovne
Trencianske Teplice
Pruske
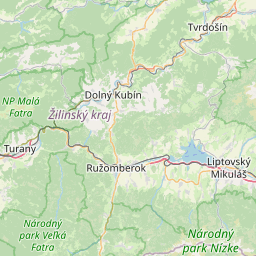
Zilina
Turany
Povazske Podhradie
Lubochna
Bytca
Zilina
Bytca
Zilina
plotly-logomark
+
−
OpenStreetMap
SRTM 0m to 255m
SRTM 0m to 1023m
SRTM 0m to 2047m
SRTM 0m to 4095m
SRTM 1024m to 3071m
SRTM 2048m to 4095m
Leaflet
| ©
OpenStreetMap
contributors
Distanc - Duration - Speed
Start
End
147.21 km - 5:43:14 - 25.73 km/h
Sept. 30, 2013, 8:17 a.m.
Sept. 30, 2013, 4:51 p.m.