Home
Daily cycle data
Combined week
Combined month
Combined year
Daily cycle: extra plots
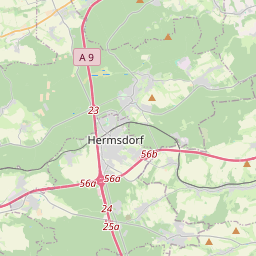
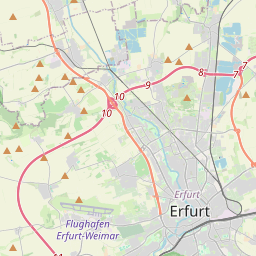
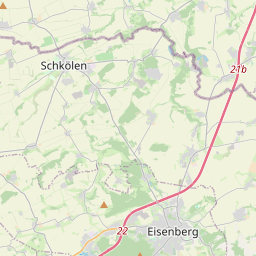
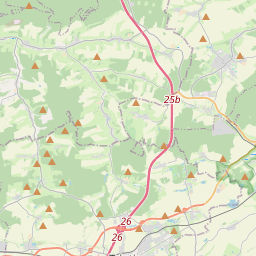
GPS Files
Github page of the project
Admin
Select a different time period for GPS data:
Start:
End:
Use date:
Only plot in shown area:
Zoom:
Cenlat:
Cenlng:
Replot
0
10
20
30
40
200
250
300
350
400
450
500
0
10
20
30
40
50
60
SRTM Elevation [m]
Elevation [m]
Speed (5 points)
Speed (50 points)
Cumlative Speed
2012-09-16 15:28:24 to 2012-09-16 18:00:13 : 49.58 km, 2:11:37 moving, 22.60 km/h, 1137 m up, -1074 m down, SRTM: 642 m up, -645 m down
Distance [km]
Elevation [m]
Speed [km/h]
14:28
14:31
14:35
14:38
14:42
14:45
14:49
14:52
14:56
14:59
15:03
15:06
15:14
15:17
15:20
15:24
15:27
15:31
15:36
15:40
15:43
15:47
15:50
15:53
15:57
16:00
16:04
16:07
16:11
16:14
16:18
16:21
16:25
16:28
16:32
16:35
16:38
16:43
16:47
16:52
16:56
16:59
Lehnstedt
Mellingen
Magdala
Possendorf
Legefeld
Magdala
Döbritschen
Großschwabhausen
Lehnstedt
Mellingen
Großschwabhausen
Legefeld
Kleinschwabhausen
Weimar
Magdala
Döbritschen
Döbritschen
Magdala
Weimar
Weimar
Weimar
Weimar
Bad Berka
Bad Berka
Bad Berka
Weimar
Weimar
Weimar
Weimar
Weimar
Weimar
Weimar
Weimar
Weimar
plotly-logomark
+
−
OpenStreetMap
SRTM 0m to 255m
SRTM 0m to 1023m
SRTM 0m to 2047m
SRTM 0m to 4095m
SRTM 1024m to 3071m
SRTM 2048m to 4095m
Leaflet
| ©
OpenStreetMap
contributors
Distanc - Duration - Speed
Start
End
49.58 km - 2:11:37 - 22.60 km/h
Sept. 16, 2012, 3:28 p.m.
Sept. 16, 2012, 6:01 p.m.