Home
Daily cycle data
Combined week
Combined month
Combined year
Daily cycle: extra plots
GPS Files
Github page of the project
Admin
Select a different time period for GPS data:
Start:
End:
Use date:
Only plot in shown area:
Zoom:
Cenlat:
Cenlng:
Replot
0
20
40
60
80
100
120
140
160
200
300
400
500
600
20
40
60
80
SRTM Elevation [m]
Elevation [m]
Speed (5 points)
Speed (50 points)
Cumlative Speed
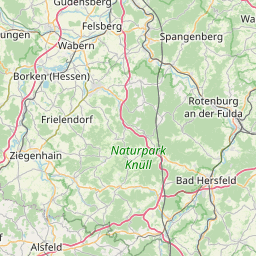
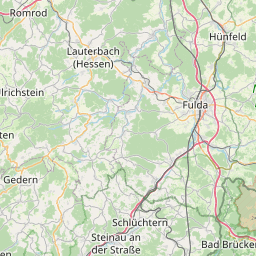
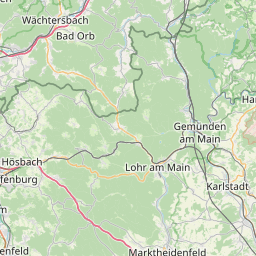
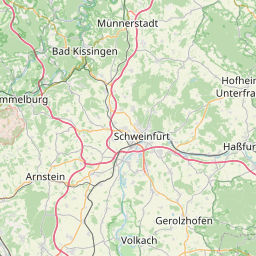
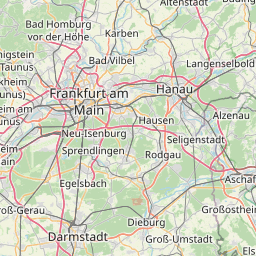
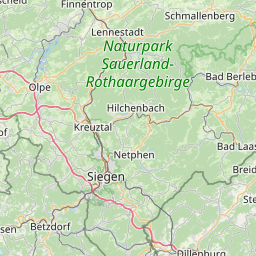
2011-08-01 07:27:08 to 2011-08-01 18:43:40 : 172.10 km, 7:17:34 moving, 23.60 km/h, 2288 m up, -2296 m down, SRTM: 1970 m up, -1973 m down
Distance [km]
Elevation [m]
Speed [km/h]
06:27
06:39
06:51
07:03
07:15
07:27
07:54
08:07
08:23
08:35
08:47
09:00
09:40
09:52
10:04
10:17
10:30
10:43
10:55
11:07
11:30
11:44
11:56
12:08
13:11
13:23
13:35
13:47
14:01
14:14
14:26
14:38
15:11
15:23
15:35
15:48
16:00
16:26
16:38
16:50
17:06
17:18
17:31
17:43
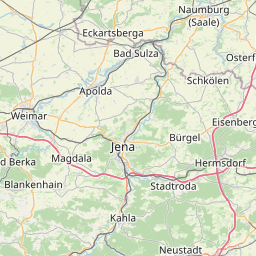
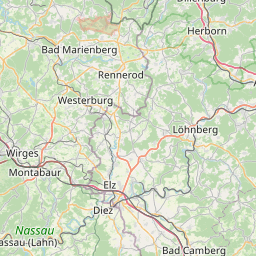
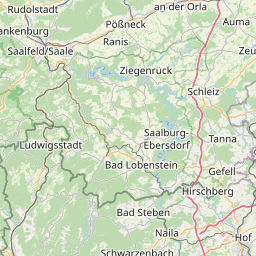
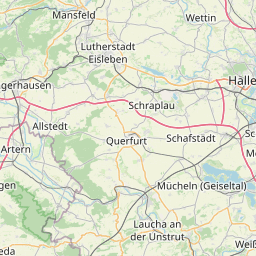
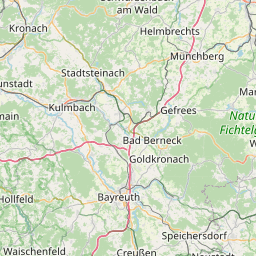
Freidewald
Grebenau
Lauchröden
Gerstungen
Niederaula
Hartmannshain
Niederaula
Heringen
Gedern
Eisenach
Ober-Seemen
Lauterbach
Ilbeshausen
Bad Hersfeld
Bad Hersfeld
Lauterbach
Eisenach
Eisenach
Bad Hersfeld
Bad Hersfeld
Eisenach
Eisenach
plotly-logomark
+
−
OpenStreetMap
SRTM 0m to 255m
SRTM 0m to 1023m
SRTM 0m to 2047m
SRTM 0m to 4095m
SRTM 1024m to 3071m
SRTM 2048m to 4095m
Leaflet
| ©
OpenStreetMap
contributors
Distanc - Duration - Speed
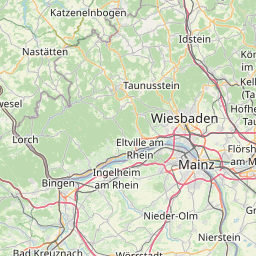
Start
End
172.10 km - 7:17:34 - 23.60 km/h
Aug. 1, 2011, 7:25 a.m.
Aug. 1, 2011, 7:33 p.m.