Home
Daily cycle data
Combined week
Combined month
Combined year
Daily cycle: extra plots
GPS Files
Github page of the project
Admin
Select a different time period for GPS data:
Start:
End:
Use date:
Only plot in shown area:
Zoom:
Cenlat:
Cenlng:
Replot
0
10
20
30
40
50
60
70
80
90
200
250
300
350
400
10
20
30
40
50
SRTM Elevation [m]
Elevation [m]
Speed (5 points)
Speed (50 points)
Cumlative Speed
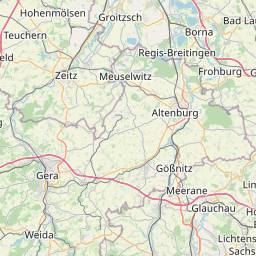
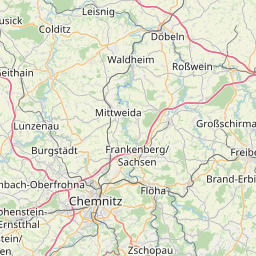
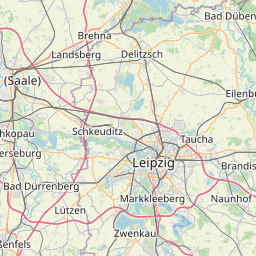
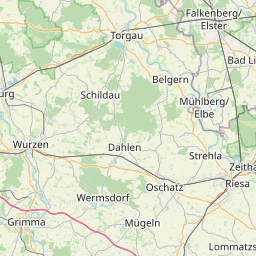
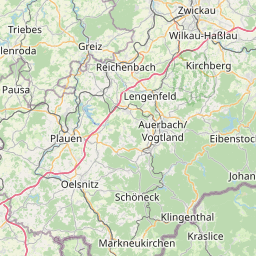
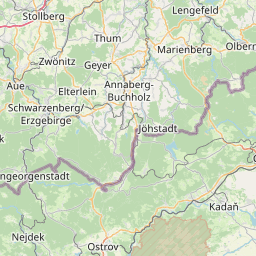
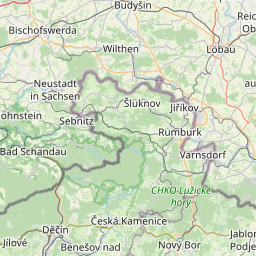
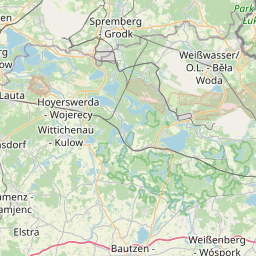
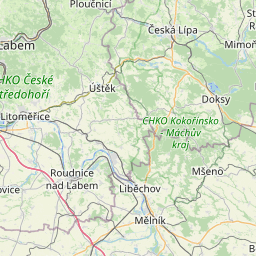
2010-05-16 13:11:00 to 2010-05-16 18:57:01 : 93.98 km, 4:12:31 moving, 22.33 km/h, 1053 m up, -1140 m down, SRTM: 908 m up, -995 m down
Distance [km]
Elevation [m]
Speed [km/h]
12:11
12:17
12:23
12:29
12:35
12:41
12:47
12:53
13:00
13:06
13:12
13:19
13:25
13:32
13:38
13:44
13:50
13:56
14:02
14:33
14:39
14:45
14:51
14:58
15:04
15:10
15:16
15:22
15:28
15:34
15:41
15:47
16:17
16:23
16:29
16:35
16:41
16:47
16:53
17:00
17:06
17:12
17:34
17:40
17:46
17:52
Dennheritz
Oberlungwitz
St. Egidien
Niederwiesa
Vollmersheim
Ronneburg
Gera
Wüstenbrand
Chemnitz
Niederwiesa
Ronneburg
Glauchau
Crimmitschau
Oberlungwitz
Gera
Ronneburg
Chemnitz
Chemnitz
Glauchau
Flöha
Chemnitz
Glauchau
Ronneburg
Crimmitschau
Gera
Crimmitschau
Glauchau
Chemnitz
Glauchau
Gera
Glauchau
Glauchau
Chemnitz
Chemnitz
Glauchau
Gera
Chemnitz
Chemnitz
Chemnitz
Chemnitz
Chemnitz
Chemnitz
Chemnitz
Chemnitz
Chemnitz
Chemnitz
Chemnitz
Chemnitz
Chemnitz
Chemnitz
Chemnitz
plotly-logomark
+
−
OpenStreetMap
SRTM 0m to 255m
SRTM 0m to 1023m
SRTM 0m to 2047m
SRTM 0m to 4095m
SRTM 1024m to 3071m
SRTM 2048m to 4095m
Leaflet
| ©
OpenStreetMap
contributors
Distanc - Duration - Speed
Start
End
93.98 km - 4:12:31 - 22.33 km/h
May 16, 2010, 1:08 p.m.
May 16, 2010, 7:08 p.m.