Home
Daily cycle data
Combined week
Combined month
Combined year
Daily cycle: extra plots
GPS Files
Github page of the project
Admin
Select a different time period for GPS data:
Start:
End:
Use date:
Only plot in shown area:
Zoom:
Cenlat:
Cenlng:
Replot
0
10
20
30
40
50
60
70
−20
0
20
40
60
80
0
10
20
30
40
SRTM Elevation [m]
Elevation [m]
Speed (5 points)
Speed (50 points)
Cumlative Speed
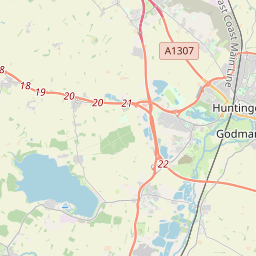
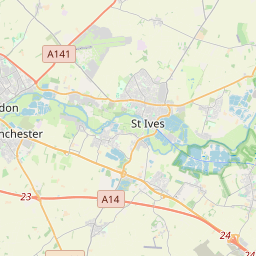
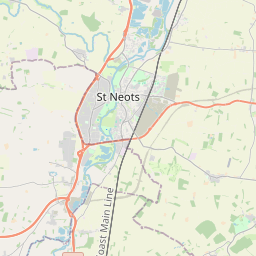
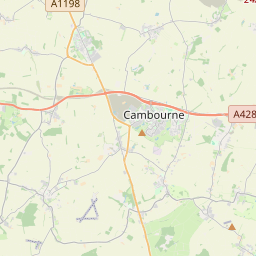
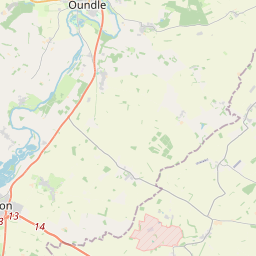
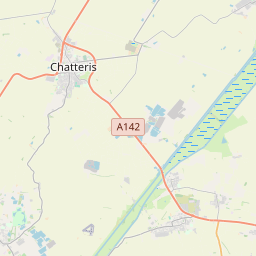
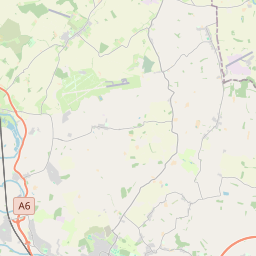
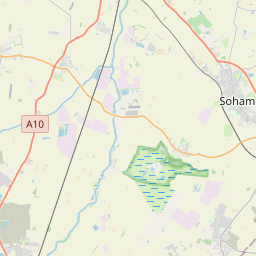
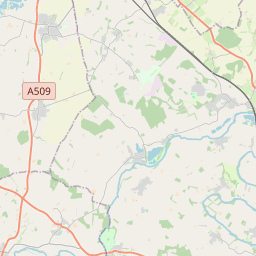
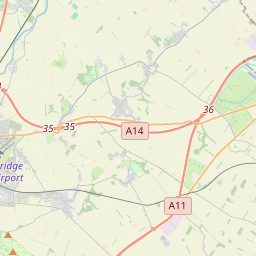
2023-05-19 12:15:55 to 2023-05-19 15:23:17 : 74.00 km, 2:51:02 moving, 25.96 km/h, 659 m up, -667 m down, SRTM: 365 m up, -366 m down
Distance [km]
Elevation [m]
Speed [km/h]
11:15
11:18
11:20
11:22
11:24
11:26
11:28
11:30
11:32
11:34
11:37
11:39
11:41
11:43
11:45
11:47
11:49
11:51
11:53
11:56
11:58
12:00
12:02
12:04
12:06
12:09
12:11
12:13
12:15
12:18
12:20
12:22
12:24
12:26
12:28
12:30
12:34
12:36
12:38
12:40
12:42
12:44
12:46
12:48
12:51
12:54
12:56
12:58
13:00
13:02
13:04
13:07
13:09
13:11
13:13
13:15
13:17
13:20
13:23
13:25
13:29
13:32
13:34
13:36
13:38
13:40
13:42
13:44
13:46
13:48
13:50
13:53
13:55
13:57
13:59
14:01
14:03
14:05
14:07
14:09
14:12
14:15
14:17
14:19
14:21
Knapwell
Hail Weston
Yelling
Great Staughton
Fenstanton
Conington
Huntington
Alconbury Weald
Great Staughton
Alconbury Weald
Little Paxton
Fenstanton
St Ives
Huntington
Huntington
Huntington
St Ives
St Ives
Huntington
plotly-logomark
+
−
OpenStreetMap
SRTM 0m to 255m
SRTM 0m to 1023m
SRTM 0m to 2047m
SRTM 0m to 4095m
SRTM 1024m to 3071m
SRTM 2048m to 4095m
Leaflet
| ©
OpenStreetMap
contributors
Distanc - Duration - Speed
Start
End
74.00 km - 2:51:02 - 25.96 km/h
May 19, 2023, 12:15 p.m.
May 19, 2023, 3:23 p.m.