Home
Daily cycle data
Combined week
Combined month
Combined year
Daily cycle: extra plots
GPS Files
Github page of the project
Admin
Select a different time period for GPS data:
Start:
End:
Use date:
Only plot in shown area:
Zoom:
Cenlat:
Cenlng:
Replot
0
10
20
30
40
50
60
80
100
120
140
160
180
10
20
30
40
50
SRTM Elevation [m]
Elevation [m]
Speed (5 points)
Speed (50 points)
Cumlative Speed
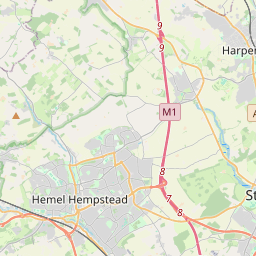
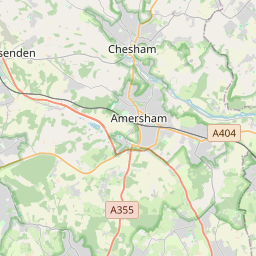
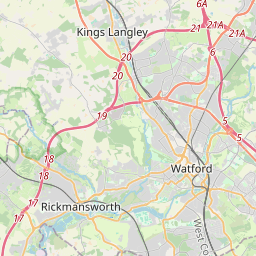
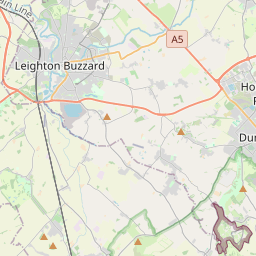
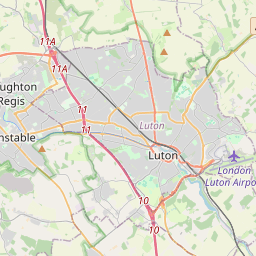
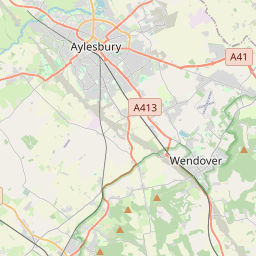
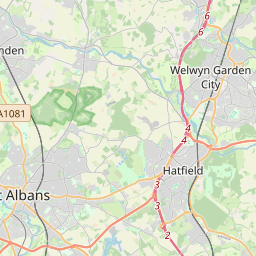
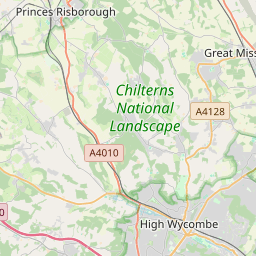
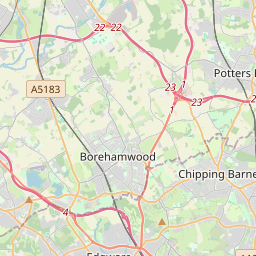
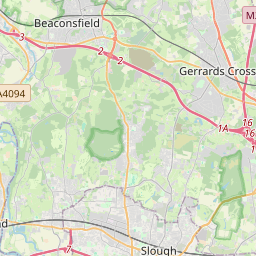
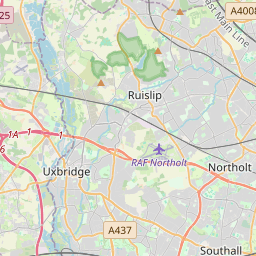
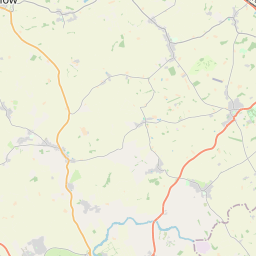
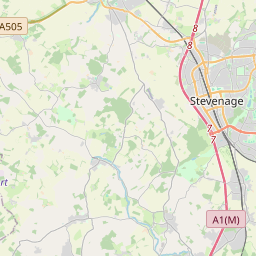
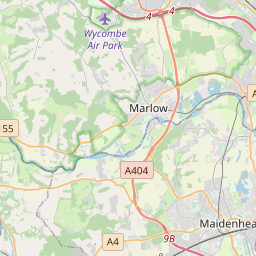
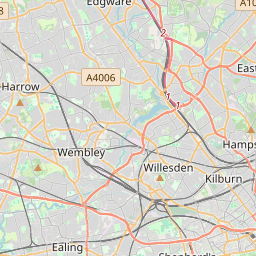
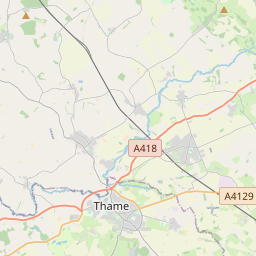
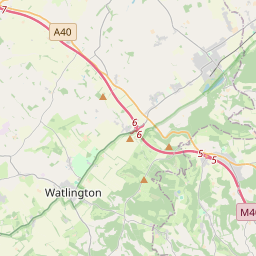
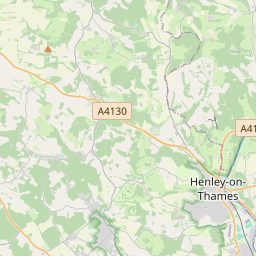
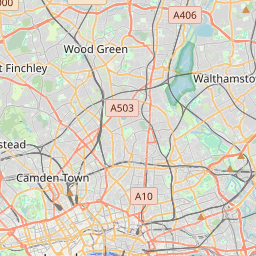
2020-07-19 10:37:21 to 2020-07-19 14:19:00 : 52.37 km, 2:50:01 moving, 18.48 km/h, 2058 m up, -2069 m down, SRTM: 618 m up, -624 m down
Distance [km]
Elevation [m]
Speed [km/h]
09:37
09:40
09:43
09:46
09:49
09:52
09:55
09:58
10:01
10:05
10:08
10:11
10:14
10:17
10:20
10:23
10:26
10:29
10:32
10:35
10:38
10:42
10:45
10:48
10:51
10:54
10:57
11:00
11:03
11:06
11:43
11:47
11:50
11:53
11:56
11:59
12:02
12:05
12:08
12:12
12:15
12:18
12:21
12:24
12:27
12:30
12:33
12:36
12:39
12:42
12:45
12:48
12:54
12:57
13:00
13:03
13:06
13:09
13:12
13:15
13:18
Botley
Flaunden
Belsize
Bedmont
Hunton Bridge
Potters Crouch
Abbots Langley
Bedmont
Botley
Orchard Leigh
Boxmoor
Botley
Bedmont
St Albans
Abbots Langley
Boxmoor
St Albans
plotly-logomark
+
−
OpenStreetMap
SRTM 0m to 255m
SRTM 0m to 1023m
SRTM 0m to 2047m
SRTM 0m to 4095m
SRTM 1024m to 3071m
SRTM 2048m to 4095m
Leaflet
| ©
OpenStreetMap
contributors
Distanc - Duration - Speed
Start
End
52.37 km - 2:50:01 - 18.48 km/h
July 19, 2020, 10:31 a.m.
July 19, 2020, 2:19 p.m.